A one-page benchmark of the U.S. promotional products market in 2025, drawn from the two industry estimates, with a plain explanation of why they do not match.
A one-page benchmark of the U.S. promotional products market in 2025, drawn from the two industry estimates, with a plain explanation of why they do not match.
Key takeaways
- U.S. promotional products distributors sold an estimated $27.1 billion in 2025, up 1.3% from 2024, according to PPAI's annual Distributor Sales Volume Estimate.
- ASI's Counselor State of the Industry puts North American distributor revenue at $27.7 billion, up 4.2%; the two figures differ in geography, sample and method, not because one is wrong.
- Online sales reached $7.1 billion, or 26.3% of the total. Retail-brand merchandise reached about $6 billion. Sustainable products reached $3.8 billion, or 14%.
- Growth was in dollars more than in units: distributors reported higher revenue with thinner margins, driven by tariffs, freight and client budget cuts.
Every buyer who plans a merchandise budget eventually asks how big this industry is and where it is going. The two answers in circulation, $27.1 billion and $27.7 billion, are both correct. This page puts the 2025 figures in one place, cites where each comes from, and explains the gap.
The headline figure: $27.1 billion, up 1.3%
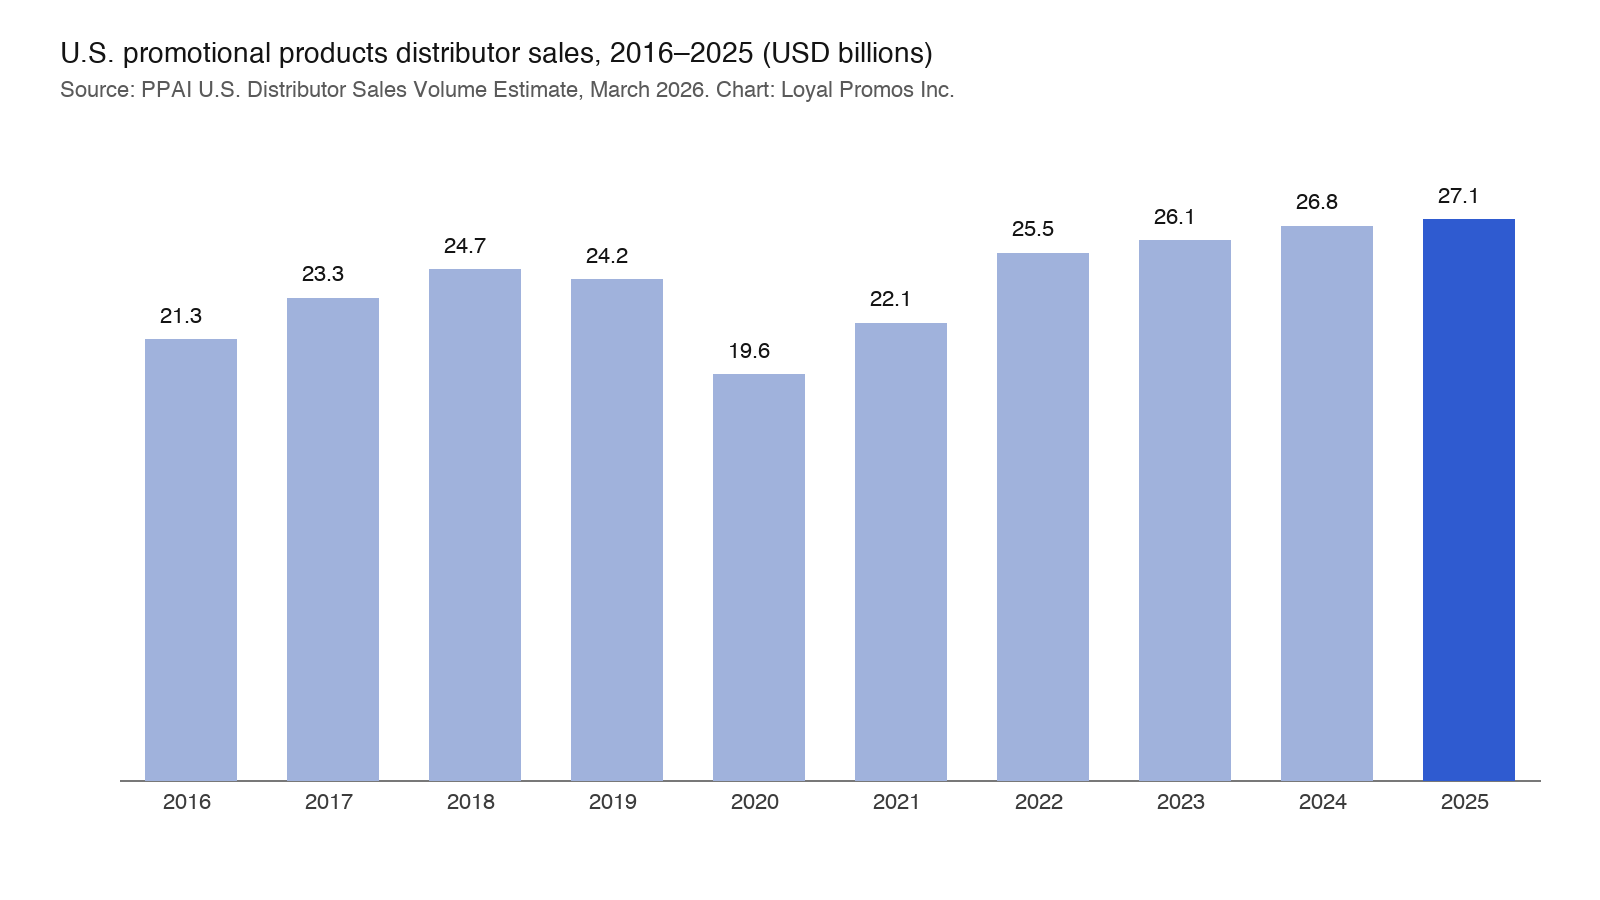
PPAI's 2025 U.S. Distributor Sales Volume Estimate, published in March 2026 with research partner MyImaginity, puts U.S. distributor sales at $27,128,982,165, the first time the industry has passed $27 billion. Growth over 2024 was 1.3%, below the 2025 rate of U.S. inflation, which is why PPAI's own economist describes the year as one in which "many distributors sold more but made less."
The ten-year series shows the shape of the recovery:
| Year | U.S. distributor sales (PPAI) |
|---|---|
| 2016 | $21.3 billion |
| 2019 | $24.2 billion |
| 2020 | $19.6 billion |
| 2021 | $22.1 billion |
| 2022 | $25.5 billion |
| 2023 | $26.1 billion |
| 2024 | $26.8 billion |
| 2025 | $27.1 billion |
Why PPAI says $27.1 billion and ASI says $27.7 billion
ASI's Counselor State of the Industry, published in January 2026, reports North American distributor revenue of $27.7 billion for 2025, up 4.2%, with the fourth quarter up 5.1%. The two estimates are not in conflict:
- Geography. PPAI measures U.S. distributors only. ASI's figure covers North America.
- Sample and method. Each organization surveys its own member base and models the total with its own weighting. Different populations produce different totals even for the same market.
- What "growth" counts. ASI's survey found that 88% of distributors raised prices in 2025, by an average of 11%. Much of the revenue growth in both estimates is price, not volume, which is consistent with PPAI's 1.3% real-terms picture.
For planning purposes, use the direction both agree on: the market is at a record in dollars, growing slowly in units, and paying more per item.
Where the sales happen
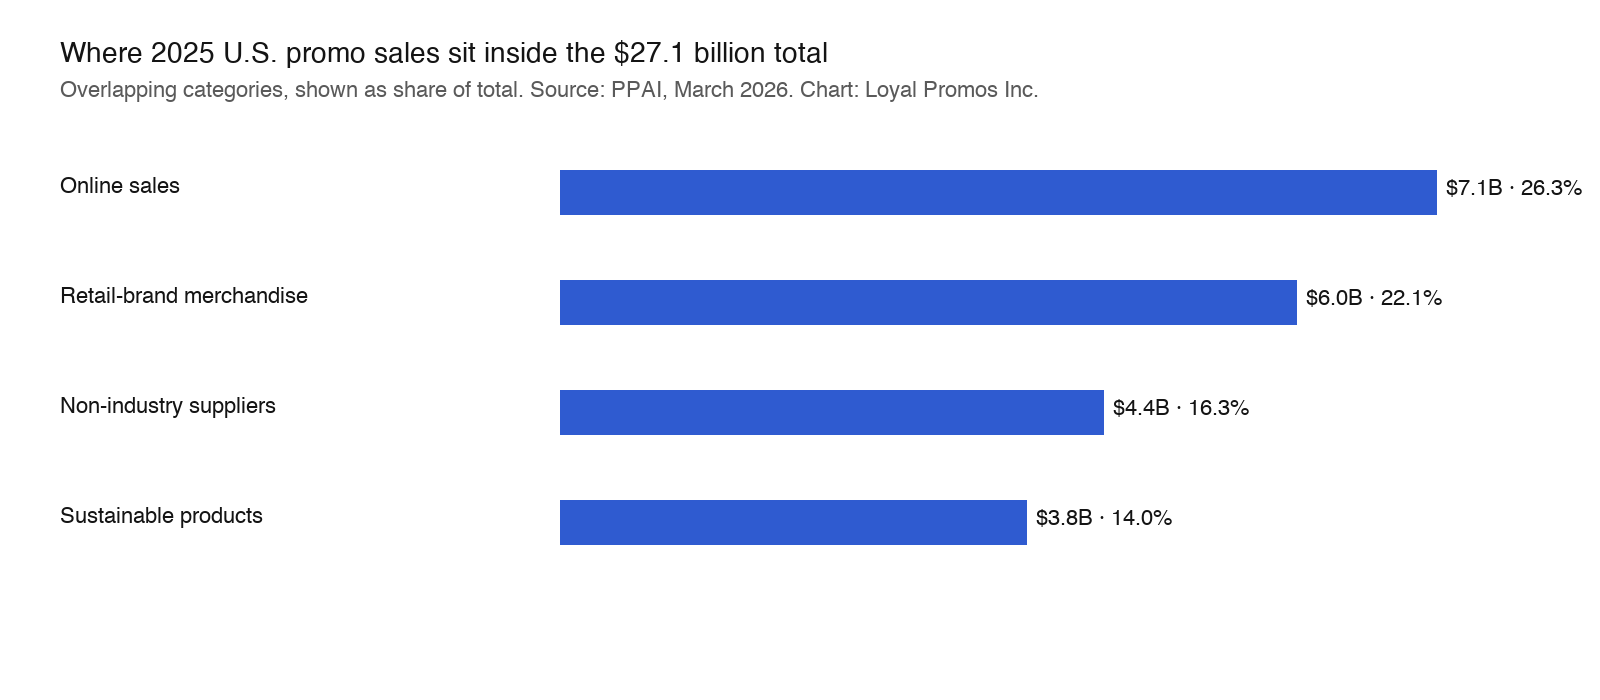
Online: $7.1 billion, 26.3% of sales. Online ordering is now a core channel rather than an experiment. Distributors under $2.5 million in annual sales grew online revenue by 11.4% in 2025, faster than the market.
Large versus small distributors. Distributors above $2.5 million in annual sales accounted for 54% of volume ($14.6 billion); those below accounted for 46% ($12.5 billion). Both groups grew about 1.3%, and the split has been stable for a decade.
Retail-brand merchandise: about $6 billion. The clearest growth signal in the data is the move toward retail-branded, higher-value items. Large distributors grew retail-brand sales 15.9%, small distributors 10.3%. PPAI reads this as margin protection: buyers choosing better items in smaller quantities.
Sustainable products: $3.8 billion, 14% of sales. Growth slowed in 2025. Sustainability has become a baseline offering rather than a growth category; the remaining growth is driven by compliance requirements. (See Sustainability Is Now Paperwork: PFAS, EPR and Proof.)
Non-industry suppliers: $4.4 billion, 16.3%. Distributors sourced this share from suppliers outside the PPAI, ASI and SAGE networks: local makers and artisans (37%), consumer retail brands (34%), general marketplaces (25%), and direct-from-overseas platforms (20%). The share barely moved from 2024, suggesting the shift has leveled off.
What squeezed margins
PPAI asked distributors which factors hurt margins in 2025. Among distributors over $2.5 million: tariffs and duties (about 60%), freight and logistics costs (about 57%), client budget cuts (about 52%), price competition (about 52%), and compliance costs (a smaller share, growing). Smaller distributors reported the same ranking at slightly lower rates. ASI's survey adds that decorators expected further price increases of 5% to 15% in 2026.
What this means if you are buying
- Budget for price, not just quantity. With unit prices up roughly a tenth in a year, a flat budget buys fewer pieces. PPAI's separate trend research found that when budgets tighten, 60% of buyers cut quantity first and only 11% cut customization. Fewer, better items is the market's own answer.
- Expect tariff language in quotes. Suppliers absorbed tariff volatility in 2025 and many now quote with explicit duty assumptions. Ask how a quote handles a tariff change between order and delivery.
- Ask for documentation early. Compliance costs are rising because buyers, especially government, healthcare and ESG-sensitive companies, ask for test reports and material declarations. Requesting them at the quote stage costs nothing; requesting them after production costs time.
- Factory-direct changes the math on the middle. A distributor's price includes the supplier's margin plus its own. Buying decorated goods directly from the factory that makes them removes one of those layers, which is the main reason a factory-direct supplier can hold pricing when tariffs and freight move. See how that works on a quote, or start from the corporate gifts and kits category.
Frequently asked questions
How big is the promotional products industry in the United States?
About $27.1 billion in U.S. distributor sales in 2025, according to PPAI. ASI's North American figure is $27.7 billion.
Is the promotional products industry growing?
In dollars, yes, but slowly: 1.3% (PPAI, U.S.) to 4.2% (ASI, North America) in 2025, with most of the increase coming from higher prices rather than more units.
What share of promotional products is sold online?
About 26% in 2025, or $7.1 billion, and the share is highest among smaller distributors.
How much of the market is sustainable products?
About $3.8 billion, or 14% of 2025 sales, with growth now tied to compliance and buyer documentation requirements rather than trend.
Sources
- PPAI Research, "PPAI Sales Volume Estimate: Promo Reaches New Height But Hampered By External Volatility," PPAI Magazine, March 2026 (2025 U.S. Distributor Sales Volume Estimate, with MyImaginity): https://www.ppai.org/media-hub/
- ASI, Counselor State of the Industry 2026 ("$27.7 Billion"), January 2026: https://www.asicentral.com/
- PPAI Research, "2026 New-ish Trends," PPAI Magazine, January 2026: https://www.ppai.org/media-hub/
Ready to Put This Into Practice?
Published per-unit merchandise prices are binding at the listed quantity tiers. Decoration or imprint, applicable setup, rush-production, and shipping charges are confirmed in your written quote.
Request a Quote